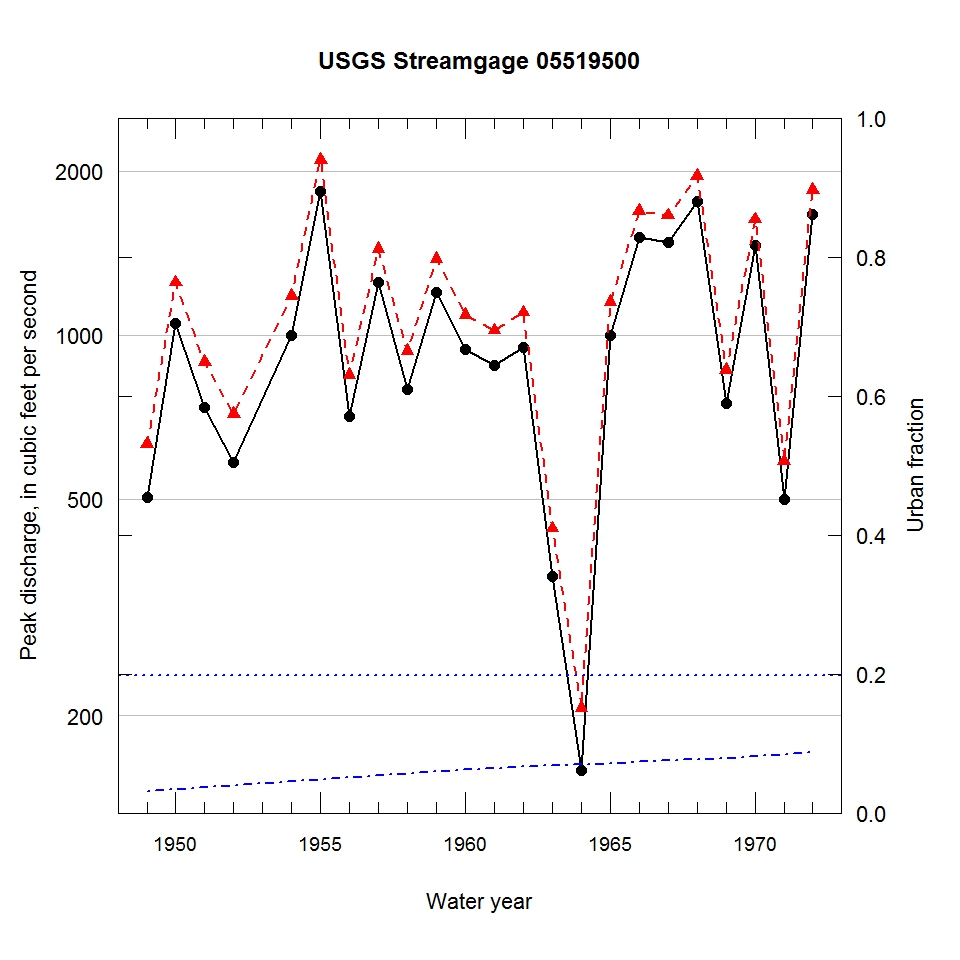
Observed and urbanization-adjusted annual maximum peak discharge and associated urban fraction and precipitation values at USGS streamgage:
05519500 WEST CREEK NEAR SCHNEIDER, IND.


| Water year | Segment | Discharge code | Cumulative reservoir storage (acre-feet) | Urban fraction | Precipitation (inches) | Observed peak discharge (ft3/s) | Adjusted peak discharge (ft3/s) | Exceedance probability |
| 1949 | 1 | -- | 0 | 0.031 | 0.685 | 504 | 631 | 0.794 |
| 1950 | 1 | -- | 0 | 0.033 | 1.517 | 1050 | 1250 | 0.359 |
| 1951 | 1 | -- | 0 | 0.036 | 0.342 | 738 | 892 | 0.610 |
| 1952 | 1 | -- | 0 | 0.039 | 0.918 | 584 | 716 | 0.738 |
| 1954 | 1 | -- | 0 | 0.045 | 1.640 | 1000 | 1180 | 0.397 |
| 1955 | 1 | -- | 0 | 0.048 | 2.887 | 1840 | 2100 | 0.088 |
| 1956 | 1 | -- | 0 | 0.051 | 0.426 | 710 | 846 | 0.641 |
| 1957 | 1 | -- | 0 | 0.054 | 2.523 | 1250 | 1440 | 0.263 |
| 1958 | 1 | -- | 0 | 0.057 | 1.204 | 794 | 935 | 0.575 |
| 1959 | 1 | -- | 0 | 0.060 | 1.245 | 1200 | 1380 | 0.292 |
| 1960 | 1 | -- | 0 | 0.063 | 1.034 | 940 | 1090 | 0.454 |
| 1961 | 1 | -- | 0 | 0.065 | 0.894 | 880 | 1020 | 0.503 |
| 1962 | 1 | -- | 0 | 0.067 | 0.253 | 950 | 1100 | 0.450 |
| 1963 | 1 | 18 | 0 | 0.068 | 0.508 | 360 | 442 | 0.903 |
| 1964 | 1 | -- | 0 | 0.070 | 0.943 | 159 | 207 | 0.981 |
| 1965 | 1 | -- | 0 | 0.072 | 1.232 | 1000 | 1150 | 0.417 |
| 1966 | 1 | -- | 0 | 0.074 | 2.668 | 1510 | 1690 | 0.172 |
| 1967 | 1 | -- | 0 | 0.076 | 1.195 | 1480 | 1660 | 0.181 |
| 1968 | 1 | -- | 0 | 0.077 | 3.613 | 1760 | 1960 | 0.111 |
| 1969 | 1 | 2 | 0 | 0.079 | 0.514 | 750 | 864 | 0.629 |
| 1970 | 1 | -- | 0 | 0.081 | 1.950 | 1460 | 1630 | 0.189 |
| 1971 | 1 | 18 | 0 | 0.084 | 0.765 | 500 | 586 | 0.824 |
| 1972 | 1 | -- | 0 | 0.088 | 3.620 | 1670 | 1850 | 0.136 |

